Homes Denver Highland
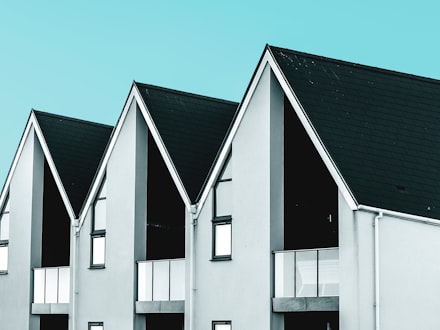
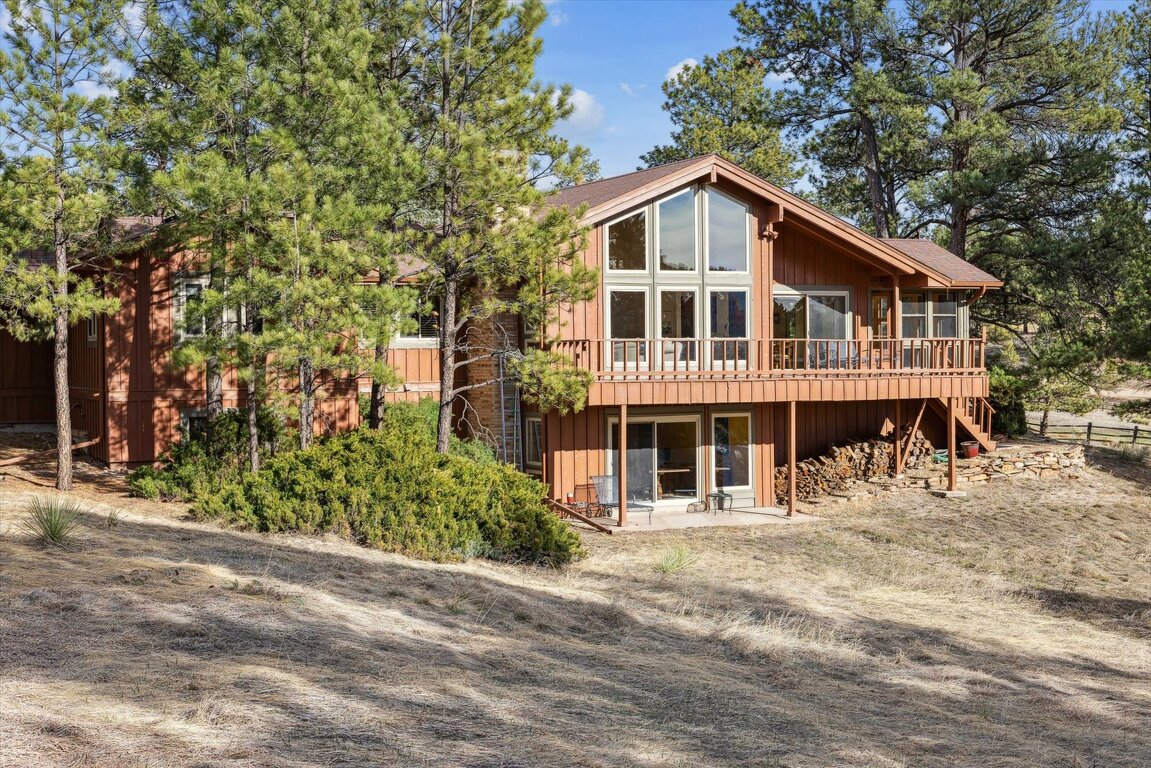
Denver Highland, located in northwest Denver, Colorado, is a vibrant residential neighborhood known for its trendy and historic vibe. The area offers a diverse range of housing options, from charming bungalows to modern condos and apartments, making it an ideal location for families, young professionals, and students.
Highland is a popular destination for foodies, shoppers, and culture lovers with its unique architecture, rich history, and mix of boutiques, wine shops, bars, restaurants, and bookstores. Visitors can explore the area's cultural offerings and enjoy lively events and festivals, including the Highland Street Fair, which features live music, food, and art.
Highland's location offers easy access to popular Denver attractions such as the Denver Art Museum and the Denver Zoo. With its lively atmosphere, convenient location, and diverse range of housing options, Denver Highland is one of the most desirable neighborhoods in Denver.
List of Zipcodes in Homes Denver Highland
Zip Code | Zip Code Name | Zip Code Population |
---|---|---|
80211 | Denver | 41,994 |
Source: Census Bureau
Demographics
State
Colorado
County
Denver County
City
Denver
Population
734,508
Zip Code | City | County | State | National | |
---|---|---|---|---|---|
Population | 41,994 | 734,508 | 734,331 | 5,759,582 | 331,426,769 |
Population Density | 9,375.4 | 4,794.0 | 4,799.5 | 55.5 | 93.8 |
Percent Male | 51.0% | 50.0% | 50.0% | 49.0% | 49.0% |
Percent Female | 49.0% | 50.0% | 50.0% | 51.0% | 51.0% |
Median Age | 38.8 | 37.6 | 37.6 | 40.2 | 39.0 |
People per Household | 2.2 | 2.2 | 2.2 | 2.8 | 2.6 |
Median Household Income | $88,057 | $69,660 | $69,646 | $115,942 | $61,963 |
Average Income per Capital | $53,426 | $45,195 | $45,172 | $50,725 | $33,235 |
Source: Census Bureau
Market Data
Zip Code | City | County | State | National | |
---|---|---|---|---|---|
Median Sale Price | $597,495 | $485,000 | $485,000 | $425,100 | $277,796 |
Median Age of Home | 56.0 | 56.0 | 56.0 | 39.0 | 49.0 |
Homes Owned | 48.0% | 46.0% | 46.0% | 67.0% | 58.0% |
Homes Rented | 44.0% | 46.0% | 46.0% | 23.0% | 31.0% |
Homes Vacant | 8.0% | 7.0% | 7.0% | 4.0% | 11.0% |
Sources: Census Bureau / Homendo
Source: REcolorado
How much is your Home worth? Click here to know...
Review current market value estimates for your home, or anyone else, anywhere in the USA.
64 properties on market in Homes Denver Highland
Active
Residential
MLS# 5268334 | 2024-11-21T00:01:29.203Z
Active
Residential
MLS# 2507971 | 2024-11-20T22:35:16.883Z
Active
Residential
MLS# 3597142 | 2024-11-16T01:02:16.289Z
Active
Residential
MLS# 6992050 | 2024-11-15T23:10:16.290Z
Active
Residential
MLS# 1796562 | 2024-11-15T19:38:16.351Z
Active
Residential
MLS# 3585331 | 2024-11-15T19:18:16.381Z
Active
Residential
MLS# 5722664 | 2024-11-15T17:29:16.459Z
Active
Residential
MLS# 6053586 | 2024-11-15T14:30:16.093Z
Active
Residential
MLS# 8510176 | 2024-11-15T04:23:16.073Z
Need more listings? Click here to search now...
15 minutes updated and accurate properties direct from your local agent. Home Evaluation. Get Loan Pre-Qualified.
James T. Wanzeck
RE/MAX Professionals
6020 Greenwood Plaza Boulevard
Greenwood Village, CO 80111, USA
6020 Greenwood Plaza Boulevard
Greenwood Village, CO 80111, USA
- (303) 887-1600 (Mobile)
- Invitation Code: masters
- jim@jimwanzeck.com
- https://JimWanzeck.com
Contact Me
Valuation Index
- Quality of Life
- Climate & Environment
- Schools & Education
- Safety & Crime
- 87%
- 83%
- 88%
- 29%
Source: Homendo
Quality of Life
Cost of Living
85.0
Health Cost Index
93.0
Commute Time
25.0
Working from Home
3.0%
Zip Code | City | County | State | National | |
---|---|---|---|---|---|
Cost of Living Index | 85.0 | 86.0 | 86.0 | 110.0 | 100.0 |
Health Cost Index | 93.0 | 96.0 | 96.0 | 119.0 | 100.0 |
Commute Time | 25.0 | 24.0 | 24.0 | 25.0 | 24.8 |
Commuting by Bus | 12.0% | 9.0% | 9.0% | 1.2% | 2.1% |
Commuting by Carpool | 23.0% | 14.0% | 14.0% | 11.0% | 13.5% |
Commuting by Auto | 62.0% | 73.0% | 73.0% | 80.0% | 79.1% |
Working at Home | 3.0% | 4.0% | 4.0% | 5.2% | 4.7% |
Source: Census Bureau
Walk Score®
Source: Walk Score®
Climate & Environment
January Average Low Temperature
15.6 °F
July Average High Temperature
88.3 °F
Annual Precipitation (inch)
18 inches
Zip Code | City | County | State | National | |
---|---|---|---|---|---|
January Average Low Temperature | 15.6 °F | 15.2 °F | 15.2 °F | 13.7 °F | 22.6 °F |
July Average High Temperature | 88.3 °F | 88.0 °F | 88.0 °F | 77.5 °F | 86.1 °F |
Annual Precipitation (inch) | 18 in. | 16 in. | 16 in. | 19 in. | 38 in. |
Source: NOAA Climate
Schools & Education
Source: Great Schools
Safety & Crime
Violent Crimes
346.4
Property Crimes
1,512.1
Zip Code | City | County | State | National | |
---|---|---|---|---|---|
Violent CrimesCalculated annually per 100,000 residents |
|||||
Assault | 191.9 | 204.6 | 476.6 | 246.3 | 250.2 |
Murder | 2.4 | 2.5 | 9.2 | 3.8 | 5.0 |
Rape | 76.8 | 71.4 | 97.8 | 67.2 | 42.6 |
Robbery | 75.3 | 64.4 | 165.3 | 63.6 | 81.6 |
Property CrimesCalculated annually per 100,000 residents |
|||||
Burglary | 461.8 | 347.5 | 544.2 | 348.4 | 340.5 |
Theft | 438.7 | 1,840.0 | 2,473.0 | 1,858.3 | 1,549.5 |
Motor Vehicle Theft | 611.6 | 603.4 | 726.3 | 384.0 | 219.9 |
Source: FBI - Crime Data Explorer